A batting average is not runs divided by innings
The most misread number in cricket. Why not-outs are subtracted before the division, and what that does to a finisher's career figure.
Ask ten people how a batting average is calculated and eight will say runs divided by innings. It is not, and the difference is large enough to change how you read entire careers.
Runs divided by dismissals
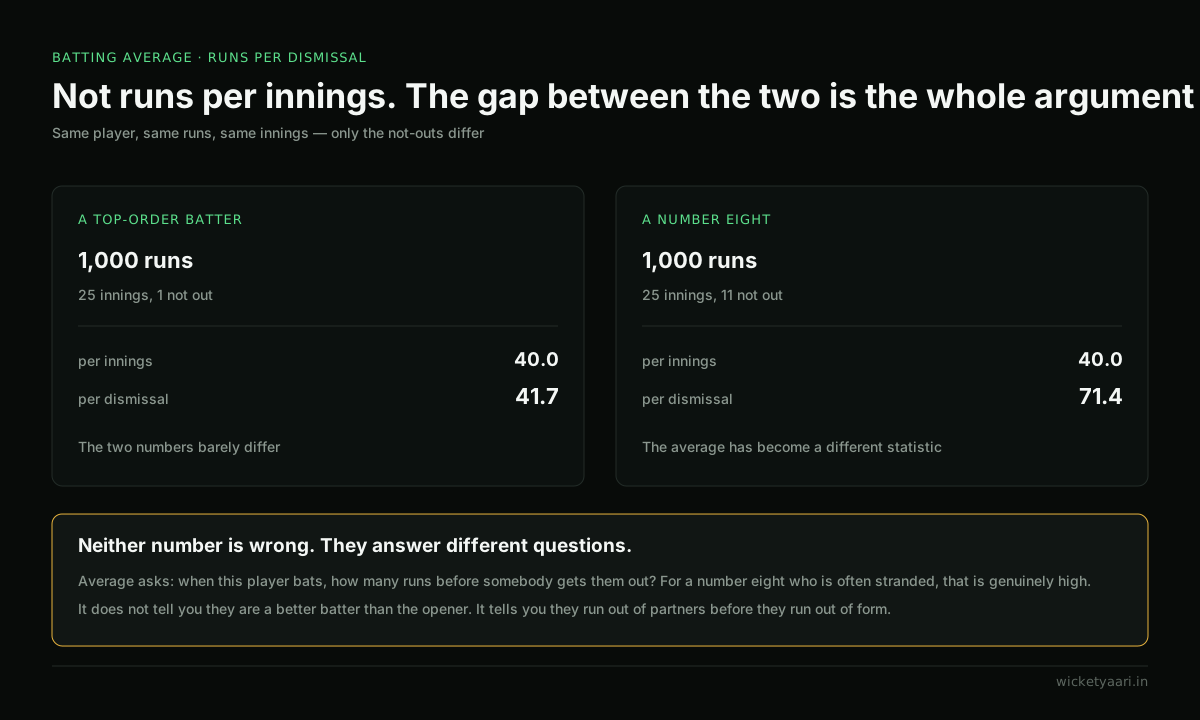
A batting average is total runs divided by the number of times the batter was out. Not-outs are subtracted from innings before the division happens.
average = runs ÷ (innings − not outs)
The reasoning is that an average is meant to answer one question: how many runs does this batter typically make before someone gets them out? An innings that ended because the team declared, or because the chase finished, did not end because anyone got them out. Counting it would answer a different question.
Our batting average calculator does this correctly, which mostly means it does the subtraction that people forget.
What it does to a finisher
Consider a middle-order batter with 3,000 runs from 120 innings, 25 of them not out.
- Runs ÷ innings: 3,000 ÷ 120 = 25.00
- Runs ÷ dismissals: 3,000 ÷ 95 = 31.58
Six and a half runs is the difference between a squad player and a first-choice pick, and it comes entirely from where you put the divisor.
Now flip it. An opener with the same 3,000 runs from 120 innings but only three not-outs averages 25.64. Nearly the same runs, nearly the same innings, six runs of separation in the published figure — and the reason is batting position, not ability.
This is why a finisher's average and an opener's average are not the same currency. Numbers seven and eight are stranded not out constantly, because the innings ends around them. It inflates the figure honestly, under a rule that is itself honest, and it still means you cannot compare the two directly.
The same runs, four different averages
The subtraction is easy to wave away until you see it move a number.
| Runs | Innings | Not outs | Runs ÷ innings | Actual average |
|---|---|---|---|---|
| 3,000 | 120 | 3 | 25.00 | 25.64 |
| 3,000 | 120 | 12 | 25.00 | 27.78 |
| 3,000 | 120 | 25 | 25.00 | 31.58 |
| 3,000 | 120 | 40 | 25.00 | 37.50 |
Every row is the same batter by the naive measure. The published averages run from 25.6 to 37.5, and the only thing that changed is where they batted.
A batter has 3,000 runs from 120 innings, 25 of them not out. What is the average?
3,000 divided by 95 dismissals, not by 120 innings. The 25 not-outs come out of the divisor before you divide.
The undefined case
If a batter has been not out in every innings they have played, the divisor is zero and the average is undefined, not infinite.
Cricket handles this by simply not printing a figure. Our calculator does the same, and shows a dash. A number that does not exist should look like a number that does not exist.
What it hides
An average is a single number standing in for a distribution, and it hides the shape completely.
A batter averaging 40 might be making forty every time, or might be making a hundred once in five innings and single figures in the other four. Those are different players, useful in different situations, and the average cannot see the difference.
The distribution is why selectors talk about "hundreds converted", "scores of fifty plus", and "innings in the fourth innings" — all of which are ways of looking behind the average at the shape it is flattening.
Why the era matters more than people admit
Averages are not a fixed currency across time. Pitches, covered wickets, bat technology, fielding restrictions and the sheer volume of cricket played have all moved, and they did not move in the same direction everywhere.
A Test average of 40 in England in the 1950s and a Test average of 40 in India in the 2010s describe different levels of difficulty, and no adjustment factor that anyone agrees on exists to convert between them. This is why comparisons across eras end up being arguments about context rather than arithmetic, and why anyone who tells you the question is settled is selling something.
The one figure that survives every era adjustment ever proposed is Don Bradman's 99.94, which is not close to any other number in the sport and does not need defending.
The number that is not a batting average at all
There is a second average in cricket with the same name and the opposite meaning, and mixing them up is the fastest way to sound lost.
A bowling average is runs conceded per wicket taken. Low is good: 20 is excellent, 40 is a problem. A batting average is runs scored per dismissal. High is good: 50 is excellent, 25 is a problem.
The two are computed from opposite sides of the same event, which is why an all-rounder is measured by the gap between them. A player whose batting average exceeds their bowling average is contributing on both sides of the ledger; a player where it runs the other way is a specialist being asked to do two jobs. That single comparison, crude as it is, has settled more selection arguments than any amount of footage.
Why the format changes what a good average is
A batting average is only comparable within its own format, and barely that.
| Format | Roughly good | Roughly outstanding | Why |
|---|---|---|---|
| Test | 40 | 55 and above | long innings, no clock, dismissal is the only end |
| ODI | 38 | 50 and above | not outs inflate finishers, chases end innings early |
| T20 | 28 | 38 and above | almost nobody bats out twenty overs |
The T20 column is the interesting one. A batter averaging 45 in T20 is usually not a better player than one averaging 30 — they are frequently a slower one who survives, and survival is worth less than it looks when the innings has a hard stop at 120 balls. Strike rate is doing the work the average cannot do, which is covered in strike rate means nothing alone.
The averages that will not settle down
Two more traps, both about sample size.
A batting average over ten innings is noise. One unbeaten 90 moves it by twenty runs; one duck moves it back. It takes something like forty completed innings before the number stops swinging on single scores, which is why a player with four Tests and an average of 62 is not yet averaging 62 — they have simply not been found out or been unlucky yet.
And a career average is a single number applied to a career that changed. A batter who averaged 55 for eight years and 28 for their last three finishes on about 46, a figure that describes neither period. The averages worth arguing about are always split — home and away, by decade, by opposition — and the split is where the actual player appears.
Read it with three other things
An average on its own is nearly meaningless. It becomes useful next to:
- Innings played. Averaging 60 from six innings is a small sample and a
- Strike rate. Forty at a strike
- Era and conditions. Averages moved a long way between the 1950s and the
large claim.
rate of 30 and forty at a strike rate of 90 are different contributions.
2010s, and moved differently in different countries.
Where our dataset sits
Every player in the WicketYaari player list carries a Test batting average, and it is the average as the format defines it: runs divided by dismissals. It appears as a column on the Cricketer puzzle board, where guessing it within twenty percent turns the cell amber rather than grey.
Which means, in the specific and slightly ridiculous case of our daily puzzle, knowing that not-outs are subtracted is worth an actual guess.
- Runs divided by dismissals, not innings
- Not-outs are subtracted from innings first
- A finisher's average is inflated honestly, by a rule that is itself honest
- All not out means the average is undefined, not infinite
The short version
Runs divided by dismissals, not innings. Not-outs come out of the divisor. That one subtraction explains most of the gap between where a finisher's average sits and where their reputation does.