Most Test runs of all time, and what the list is really measuring
Tendulkar's 15,921 leads a list that rewards longevity above everything. The averages beside those totals tell a very different story about who was hardest to dismiss.
The list of leading Test run-scorers is a list of long careers. That is not a criticism; surviving twenty years of international cricket is itself an achievement. But it is worth knowing what the number is measuring before using it to settle an argument.
- Sachin Tendulkar's 15,921 leads by more than 2,500 runs
- Every name in the top ten played at least 130 Tests
- The averages beside the totals reorder the list substantially
- Total runs measures opportunity and durability as much as ability
The list
| Runs | Batter | Country | Tests | Average |
|---|---|---|---|---|
| 15,921 | Sachin Tendulkar | India | 200 | 53.78 |
| 13,378 | Ricky Ponting | Australia | 168 | 51.85 |
| 13,289 | Jacques Kallis | South Africa | 166 | 55.37 |
| 13,288 | Rahul Dravid | India | 164 | 52.31 |
| 12,472 | Alastair Cook | England | 161 | 45.35 |
| 12,400 | Kumar Sangakkara | Sri Lanka | 134 | 57.40 |
| 11,953 | Brian Lara | West Indies | 131 | 52.88 |
| 11,867 | Shivnarine Chanderpaul | West Indies | 164 | 51.37 |
Tendulkar's margin is the striking part. Two and a half thousand runs clear is roughly twenty-five Test hundreds of daylight.
Reordered by average
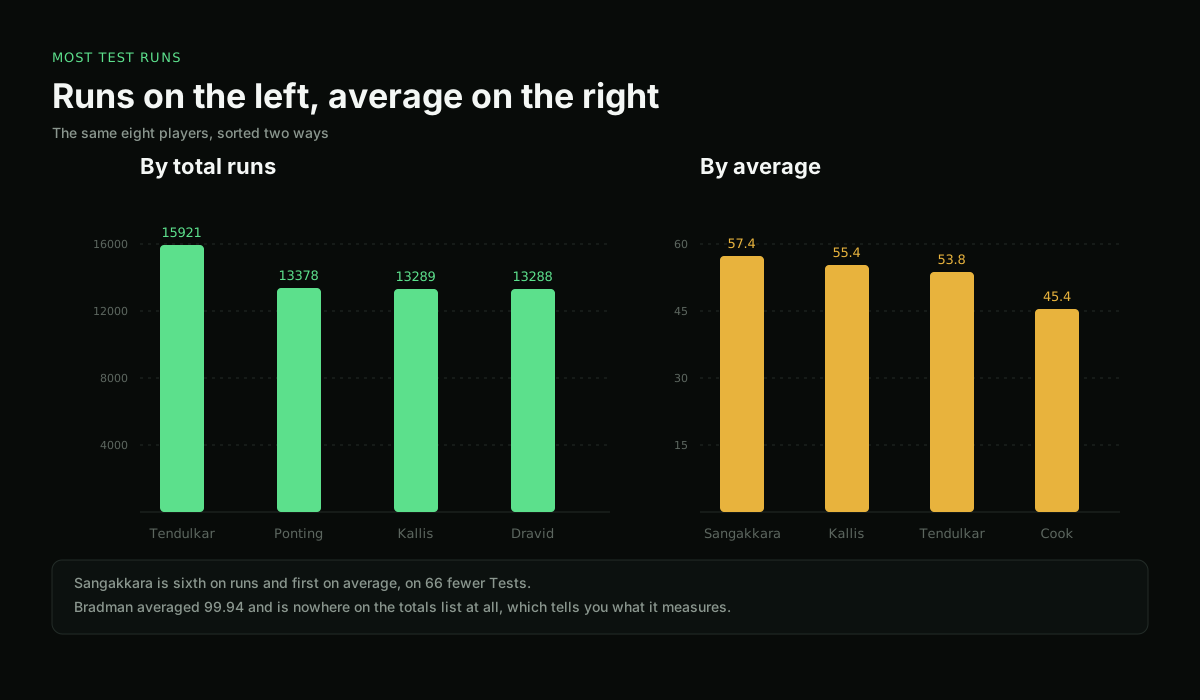
Take the same names and sort by average instead, and the list changes shape:
| Average | Batter | Tests |
|---|---|---|
| 57.40 | Kumar Sangakkara | 134 |
| 55.37 | Jacques Kallis | 166 |
| 53.78 | Sachin Tendulkar | 200 |
| 52.88 | Brian Lara | 131 |
| 52.31 | Rahul Dravid | 164 |
| 51.85 | Ricky Ponting | 168 |
| 51.37 | Shivnarine Chanderpaul | 164 |
| 45.35 | Alastair Cook | 161 |
Sangakkara moves from sixth to first on 66 fewer matches. Cook, who is fifth on runs, is last here by a margin — a career built on availability and concentration rather than on a high average, which is a legitimate way to score twelve thousand Test runs and a different one.
Kumar Sangakkara scored 12,400 Test runs at 57.40. Why is he only sixth on the totals list?
134 Tests to Tendulkar's 200. Total runs rewards matches played, and Sri Lanka's schedule gave him fewer of them than India's gave Tendulkar.
What the list is measuring
Longevity. Every name played at least 131 Tests. Nobody has ever entered this list on brilliance alone.
Schedule. India, England and Australia play more Tests than most nations, so their players accumulate faster. That is not merit; it is fixture list.
Batting position. Numbers three, four and five bat in almost every innings. Openers face the new ball more often but also get out cheaply more often.
Era. Batting averages rose from the 1990s onwards. Comparing a total from 1985 with one from 2015 without adjusting for that is comparing two different games.
- The player was very good for a very long time
- They were selected consistently
- Their board played a lot of Tests
- They stayed fit
- How good, relative to peers
- What the bowling was like
- Whether the runs came when they mattered
- How they compare across eras
How the board changes from here
Run lists move slowly and predictably, which makes them unusually easy to forecast compared with almost anything else in cricket.
A batter needs roughly 700 Test runs a year to be gaining on the leaders, and almost nobody manages that for more than a few seasons in the current schedule. The number of Tests played per year per country has been flat or falling for two decades while the number of T20 matches has multiplied, so the natural rate of accumulation has slowed for everybody at once.
The practical effect is that the top of this list is more stable than it has ever been. The batters at the top played fifteen to twenty-four year careers in an era that scheduled more Test cricket than the current one does, and the players closest to them will need to play into their late thirties in a format their boards schedule less of each year.
What it takes to reach the top of it
Fifteen thousand Test runs is not a batting achievement. It is a batting achievement plus a fitness achievement plus a selection achievement plus a scheduling accident, and the last one is doing more work than people credit.
To score 13,000 runs at an average of 50 you need 260 completed innings, which is roughly 150 Tests, which is roughly fifteen years of being picked. In that time you must avoid a serious injury, avoid a two-year loss of form, avoid being dropped in a rebuild, and play for a board that schedules a lot of Test cricket.
The last point is the quiet one. Cricketers from countries that play twelve Tests a year accumulate at twice the rate of equally good cricketers from countries that play six, and no adjustment is ever made for it in the record books. Two of the names on any all-time run list are there partly because of who they played for and how often that board arranged fixtures.
| Requirement | Roughly |
|---|---|
| Career length | 15 years or more |
| Tests | 130 to 200 |
| Completed innings | 230 to 300 |
| Average needed at 200 innings | 60 for 13,000 runs |
| Average needed at 300 innings | 43 for 13,000 runs |
A second thing the list hides is the opposition. Runs against every attack count the same, so a career spent in an era of weak bowling and flat pitches produces a larger total than an equally good career spent facing four fast bowlers on uncovered surfaces. Nobody has found a way to adjust for this that survives contact with an argument, which is why the raw list is still the one everybody quotes.
Why the totals list and the average list barely overlap
They measure opposite things, and the overlap is small enough to be surprising.
A total rewards longevity, which means playing on past your peak. An average rewards peak quality, which means being at your best for every innings you played. Every extra year a great batter plays adds runs to the first list and, almost always, subtracts from the second.
The players who appear high on both did something unusual: they either retired close to their peak with a long career already behind them, or they simply did not decline. There are very few of the second kind in the history of the sport and the arguments about who they are will outlast everybody reading this.
The name that is missing
Don Bradman scored 6,996 Test runs. He is nowhere near this list, and he averaged 99.94, which is roughly forty runs clear of everybody who has ever played.
He played 52 Tests, in an era with far fewer of them and a world war in the middle. Whatever total runs is measuring, it is not the thing that made Bradman Bradman, and that single omission is the clearest argument for reading the average column first.
- Tendulkar leads by 2,500 runs, on 200 Tests that nobody else has approached
- Sorting the same names by average moves Sangakkara to the top
- Longevity, schedule and batting position drive the totals as much as skill
- Bradman is absent from the list entirely, which tells you what it is not measuring
For why an average is calculated the way it is, see a batting average is not runs per innings. For the top of the individual-score list, see highest individual scores in Test cricket.