Duckworth-Lewis-Stern, explained without the table
Why a side chasing in 34 overs is not chasing two thirds of the target, and why revised targets that look harsh are usually correct.
The Duckworth-Lewis-Stern method has a reputation for being incomprehensible. It is not. The table is incomprehensible. The idea behind it takes about four minutes.
One idea: an innings is a stock of resources
A batting side starts an innings holding two things: overs to bat, and wickets to lose. DLS treats those two together as a single stock, and says a full innings is 100 percent of it.
Everything else follows. When rain shortens an innings, the method compares how much of that stock each side actually had available, and adjusts the target in proportion.
revised target = team 1 score × (team 2 resources ÷ team 1 resources) + 1
That is the whole method. The famous table exists only to answer one question: given this many overs left and this many wickets down, what percentage of the stock is left?
Why 34 overs is not 68 percent
Here is the part that generates the angry tweets.
A side with all ten wickets and 34 of 50 overs has not got 68 percent of an innings. It has closer to 78 percent. It feels wrong, and it is right.
Resources are not linear in overs, because wickets become more valuable as the overs shrink. A team with ten wickets and 34 overs can attack from ball one; a team with three wickets and 34 overs cannot. The table's whole job is to price that difference, and it prices it steeply.
So revised targets frequently look harsh on the chasing side. They are not. The arithmetic simply refuses to pretend that ten wickets and 34 overs is the same proposition as four wickets and 34 overs.
Roughly what the curve looks like
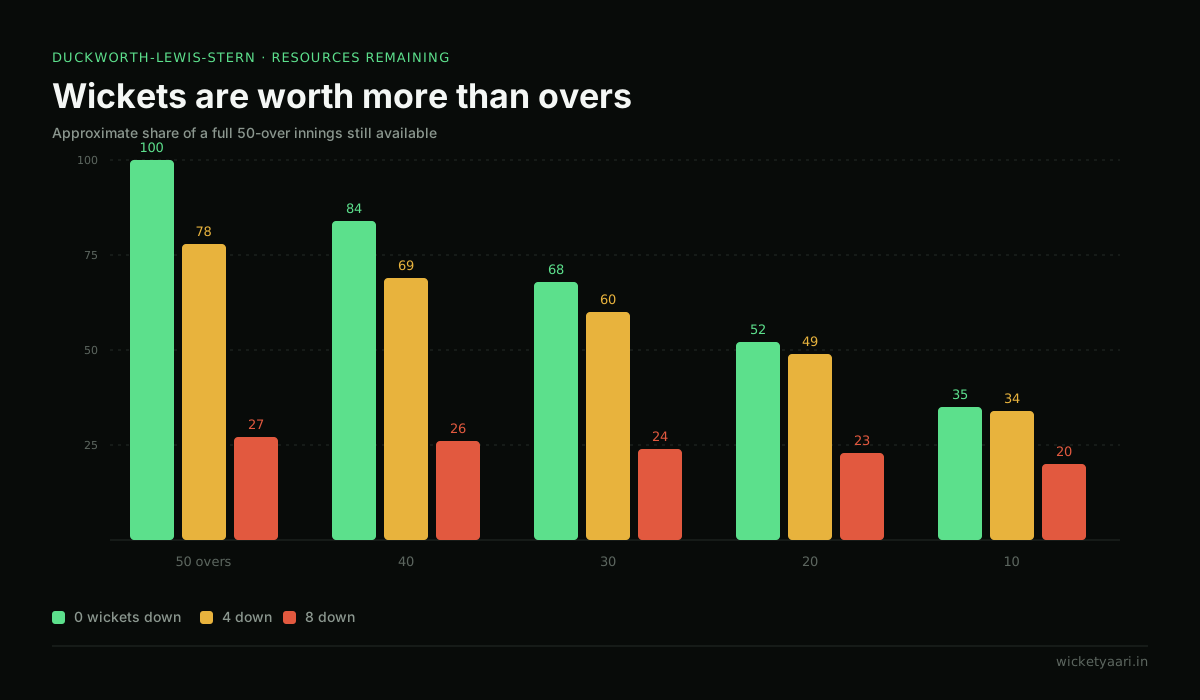
Approximate resources remaining, as a percentage of a full 50-over innings:
| Overs left | 0 wickets down | 4 down | 8 down |
|---|---|---|---|
| 50 | 100% | 78% | 27% |
| 40 | 84% | 69% | 26% |
| 30 | 68% | 60% | 24% |
| 20 | 52% | 49% | 23% |
| 10 | 35% | 34% | 20% |
Read down the last column. A side eight wickets down barely gains anything from having more overs, because it has almost nothing left to spend them with. Read across the top row and the loss is steady. That difference between the rows is the entire method.
The rule you can feel in your gut
Wickets in hand are worth more than overs remaining, and the gap widens as the innings shortens.
Once you hold that, most DLS outcomes stop being surprising. A side that is 0 for none when the rain comes gets a hard target, because it kept everything. A side that is 6 down gets a soft one, because it has already spent most of what it had.
A side has all ten wickets and 34 of its 50 overs left. Roughly what share of a full innings does DLS say it holds?
Resources are not linear in overs. With every wicket in hand, 34 overs is worth far more than two thirds of an innings, which is why revised targets look harsher than people expect.
What the Stern refinement added
The original 1997 method was built on scoring patterns from the eighties and nineties. Then Twenty20 arrived, four hundred became a reachable one-day score, and the model started under-predicting what a modern side could do at the death.
Steven Stern's revision, adopted in 2014, adjusted the resource curve for very high scores and faster scoring rates. It is why the method gained a third letter, and why comparing a modern DLS decision to one from 2003 is comparing two different models.
Why a target can go up
The most common complaint about the method is that a rain-reduced target sometimes rises above the original score, and it sounds like an error. It is not.
Consider a side that scores 250 from 50 overs. Their innings was spread across fifty overs with the caution that requires. If the chasing side is told it has only 25 overs, it can bat with far more freedom: it never has to survive the middle overs, and it can lose wickets faster because it will run out of overs before it runs out of batters.
So the second side, chasing in 25 overs with ten wickets, has more resources per over than the first side had. The target rises to compensate. A revised target of 193 from 25 rather than a proportional 125 is not a punishment; it is the method saying that 25 overs with ten wickets is worth 77 per cent of a full innings, not 50 per cent.
What it replaced, and why those were worse
Three methods were used before Duckworth-Lewis, and every one of them produced a result that was visibly absurd at least once.
Average run rate simply scaled the target by overs. It ignored wickets entirely, so a side one wicket down and a side eight down were treated identically, and it systematically favoured the chasing team.
Most productive overs removed the chasing side's target overs from the highest-scoring overs of the first innings. In the 1992 World Cup semi-final it left South Africa needing 22 runs from one ball, which is the moment the sport decided the problem was worth solving properly.
Discounted most productive overs was a patch on that and had the same shape of failure.
Duckworth-Lewis was proposed by two statisticians who were not employed by cricket, was adopted in 1997, and has been refined twice since. It is not intuitive, and that is the price of it being right.
What it does not do
DLS knows about overs and wickets. It knows nothing else.
- It does not know the pitch got harder to bat on after the rain.
- It does not know your best bowler had already bowled out.
- It does not know one side was chasing under lights and the other was not.
Every one of those is a real cricketing factor, and none of them is in the model, because a tiebreaker that took them into account would be a tiebreaker somebody could argue with. The method trades accuracy for the thing tournaments actually need, which is a number nobody can dispute after the fact.
Our estimator is an estimate
We have a Duckworth-Lewis estimator and it says so on the page, in a box, before you use it.
The official method uses a licensed resource table and, in professional cricket, purpose-built software. What ours runs is a coarse interpolation across a simplified table. It gets the shape right and the direction right, and it is close enough to settle an argument about why a target moved. It is not close enough to settle a real match, and we would rather say that than have someone quote it as authoritative.
- An innings is a stock of overs and wickets; a full one is 100 percent
- Rain takes some away, and the target moves in proportion to what each side had
- Wickets are worth more than overs, and increasingly so as overs run out
- Our estimator explains the shape; it is not the official method
The short version
An innings is a stock of overs and wickets. A full one is 100 percent. Rain takes some of it away, DLS works out how much each side had, and rewrites the target in proportion. Wickets matter more than overs, and more so as the overs run out.
That is it. The table is only a lookup.
If your match was not rain-affected and you are arguing about qualification instead, the number you want is net run rate, which works on a completely different principle.